As the ancient Chinese proverb says: "Tell me and I will forget; show me and I will remember; involve me and I will understand." Whether this is applied to ancient tutelage or modern scholarship, the role of visual and hands-on learning in education cannot be underestimated. This lesson has certainly not been lost when it comes to some of the most important issues facing society today - things like poverty, disease, and the threat of Climate Change.
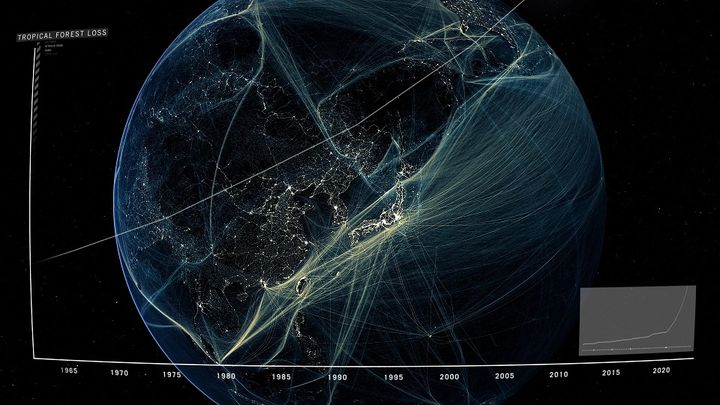
In fact, one could make the point that visuals are absolutely essential to the teaching of Climate Change, given the sheer amount of information being dealt with and the tendency of many to misinterpret it. It is for this reason that the International Geosphere-Biosphere Programme (IGBP) developed the "Planetary Dashboard" - a set of 24 global indicators that give immediate visual representation to the influence human beings have had on the planet in recent decades.
This influence, according to some scientists, historians and ecologists, can be summed up succinctly with the term "Anthropcene Era". Officially coined by ecologist Eugene F. Stoermer in the 1980's, the term has since been popularized by Nobel Prize-winning atmospheric chemist Paul Crutzen - who regards the influence of human behavior on the Earth's atmosphere in recent centuries as so significant as to constitute a whole new geological epoch.
But beyond our influence on the atmosphere - i.e. the amount of hydrocarbons we have contributed that led to a measurable Greenhouse Effect - there are the also the factors of human population growth, urbanization, food consumption, land use, and the extensive impact these have had on our planet's ecosystems, effecting everything from ocean acidification and deforestation to biodiversity deterioration.
This is what is referred to by the IGBP as the "Great Acceleration" - a period in human activity that began with in the industrial revolution in 1750 and has continued to the present. As Professor Will Steffen, who led the joint project between the International Geosphere-Biosphere Programme (IGBP) and the Stockholm Resilience Center, explained: "“It is difficult to overestimate the scale and speed of change. In a single lifetime humanity has become a planetary-scale geological force."
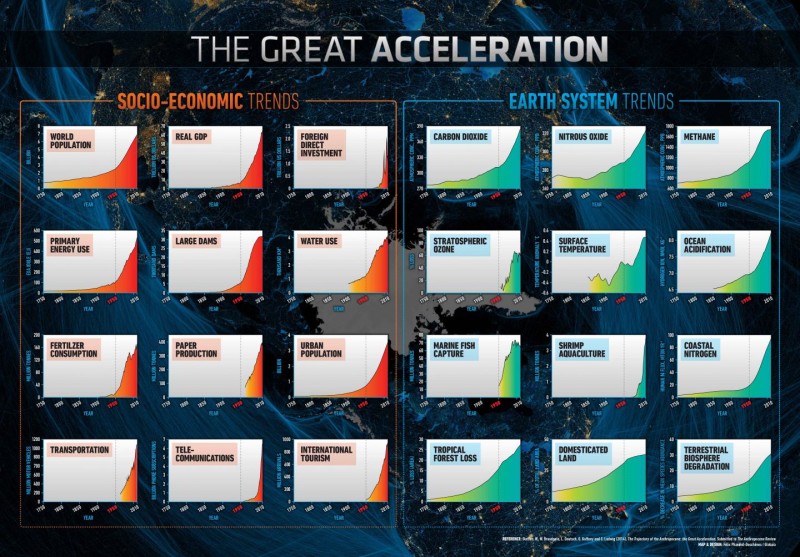
Composed of two sets of charts, the Planetary Dashboard compares humanity's expanding presence on the planet in terms of 12 different indicators (shown above), which include things like economic growth (GDP), total population, foreign direct investment, energy consumption, telecommunications, transportation and water use.
On the other side of the aisle, twelve indicators show the concurrent changes that took place within several major environmental components - such as the carbon cycle, the nitrogen cycle and biodiversity. Taken together, these indicators highlight how the trajectories of Earth and human development are now tightly bound.
These indicators were published in the January issue of the Anthropocene Review and presented at the World Economic Forum in Davos, Switzerland, from the 21st to 24th of January. Since that time, they have been made available through the IGBP's website as a visual presentation. As lead author of the the paper, Steffen claimed that even he and his colleagues were surprised by what their "dashboard" indicated.
"When we first aggregated these datasets," he said, "we expected to see major changes, but what surprised us was the timing. Almost all graphs show the same pattern. The most dramatic shifts have occurred since 1950. We can say that around 1950 was the start of the Great Acceleration."
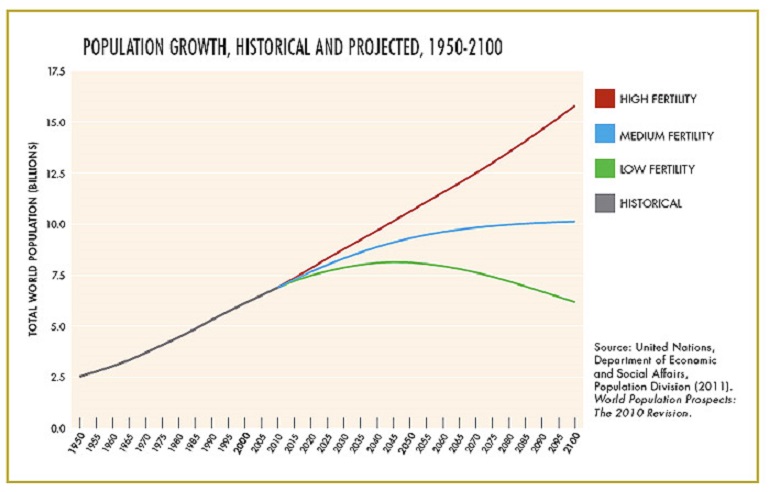
In that, Steffen is certainly correct. In 1950, the global population was just over 2.5 billion; and of those, 746 million lived in urban environments. By 2009, the population had more than doubled, exceeding 6.8 billion people, of which 3.42 billion lived in cities. Similarly, water usage during these years quadrupled, going from over 1000 cubic kilometers to around 4000.
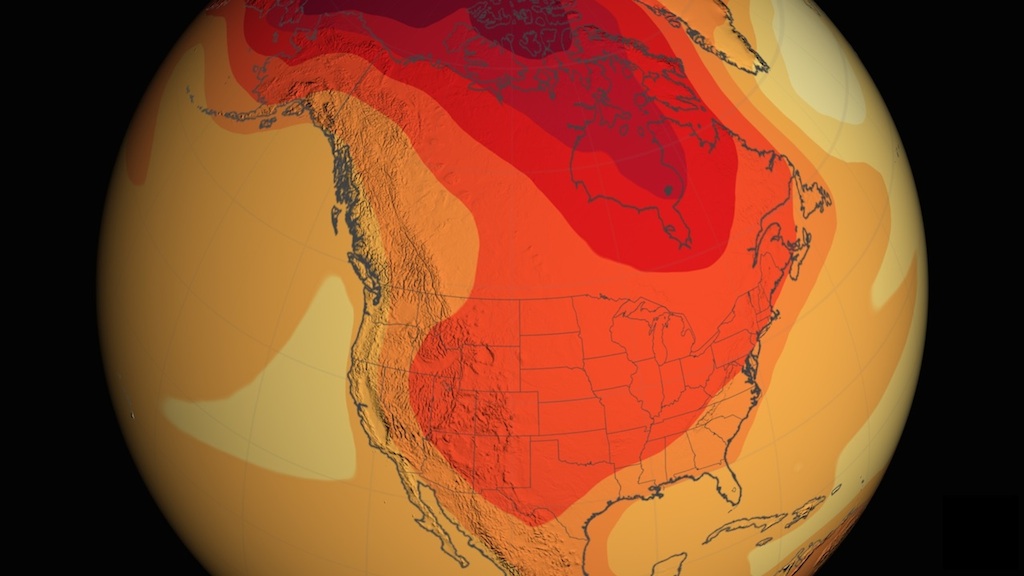
Meanwhile, data obtained by the NOAA's Mauna Loa facility indicates that the concentrations of carbon dioxide gas went from 315 parts per million (ppm) during these same decades to 400. This corresponds to data obtained by NASA that shows that as of this decade, average global temperatures have increased by 1.1 °F (0.6 °C) from the 1950 baseline.
The findings provide strong evidence that in recent decades, key components of the Earth System have moved beyond the natural variability exhibited in the last 12,000 years, a period geologists call the Holocene. The Holocene, which is Latin for "entirely recent," began at the end of the last ice age and provided the stability for agriculture to develop, leading eventually to sedentary living, townships, and the various institutions that we know as "civilization".
By contrast, the Anthropocene Era has been marked by changes that have been almost entirely human-driven, owing to a combination of more people, more of them living in cities, more industry, and more fossil fuel consumption. "After 1950 you can see that major Earth System changes became directly linked to changes largely related to the global economic system," said Steffen. "This is a new phenomenon and indicates that humanity has a new responsibility at a global level for the planet."
Granted, the term Anthropocene has been keenly contested by geologists, Earth System scientists and others since it was first coined in the 1980s. In addition, it has not yet been formalized by the International Commission on Stratigraphy, nor can proponents agree on when the era truly began. Some say the dawn of agriculture 10,000 years ago - the Neolithic Age - is a likely candidate, while others say the industrial revolution (around the late 1700s).
However, Steffen and his colleagues argue that only since the latter half of the 20th century has humanity's presence been decisive. As it states in their paper: "Of all the candidates for a start date for the Anthropocene, the beginning of the Great Acceleration is by far the most convincing from an Earth System science perspective. It is only beyond the mid-20th century that there is clear evidence for fundamental shifts in the state and functioning of the Earth System that are beyond the range of variability of the Holocene, and driven by human activities and not by natural variability."
More striking, perhaps, than the correlation between the 24 indicators is the startling prospects they suggest about the future. In visualizing humanity's "Great Acceleration" during the past few decades, we have to wonder what might be happening in the next few. Most likely, this will include a continued rate of global economic development powered by investment, innovation, and continued economic growth - this time, concentrated in developing nations.
But at the same time, there will need to be concurrent expansions in the use of alternative energy, transport, and more sustainable means of production and consumption. By 2050, it is estimated that between 9 and 10 billion human beings will be occupying the planet, the majority of which will live in cities. If we hope to feed, clothe, house, employ, educate, and provide sanitation for these people, creative solutions will be needed, and soon!
The original 24 indicators contained with the Planetary Dashboard were published in the first IGBP synthesis in 2004, when Professor Steffen was IGBP Executive Director. The term 'Great Acceleration' was not used until 2005 at the Dahlem Conference on the history of the human-environment relationship, which brought together many IGBP scientists. This new research is part of IGBP's final synthesis, which will be completed in 2015.
To download the image of the Great Acceleration, or access the data collection, click here and scroll to the bottom of the page. And be sure to check out this video from the IGBP titled "Welcome to the Anthropocene":
Sources:
- anr.sagepub.com
- www.giss.nasa.gov/research/news/20140121/
- e360.yale.edu/slideshow/the_world_at_7_billion/13/1/
- phys.org/news/2015-01-planetary-dashboard-great-human.html
- www.medicaldaily.com/anthropocene-new-geological-period-began-1950-scientists-say-318036
- www.igbp.net/news/pressreleases/pressreleases/planetarydashboard
- www.sciencedaily.com/releases/
Image Credits:
- Top Image: igbp.net
- Planetary Dashboard: igbp.net
- Population Growth: e360.yale.edu
- Global Warming: nasa.gov
- Anthropocene: Arlind Boshnjaku/youtube.com