Yun Li's team
We conducted a large-scale secondary analysis of spatial transcriptomics (ST) data to benchmark 20 state-of-the-art (SoTA) methods for detecting spatially variable genes (SVGs). Using our curated STimage-1K4M dataset spanning 662 slides across 18 human tissue types, we systematically evaluated method performance in recovering pathologist-annotated domain-specific markers, robustness across tissues and disease states, sensitivity to rotation, and computational scalability. Our findings reveal substantial variation in method reliability across biological contexts and highlight key limitations in existing approaches. We further constructed an SVG atlas, enabling deeper biological interpretation and guiding downstream multi-tissue studies. This work provides a valuable roadmap for robust, context-aware ST analysis, with implications for biomarker discovery and precision pathology.
We present a large-scale analysis of ST data with the goal of rigorously benchmarking methods for detecting SVGs and building a comprehensive atlas of spatial gene expression programs across tissues and disease states. Leveraging the STimage-1K4M dataset collected from the GEO platform and other public resources, we evaluated the performance of 20 computational methods across 662 ST slides encompassing a broad range of tissue types, technological platforms, and biological conditions (Figure 1a).
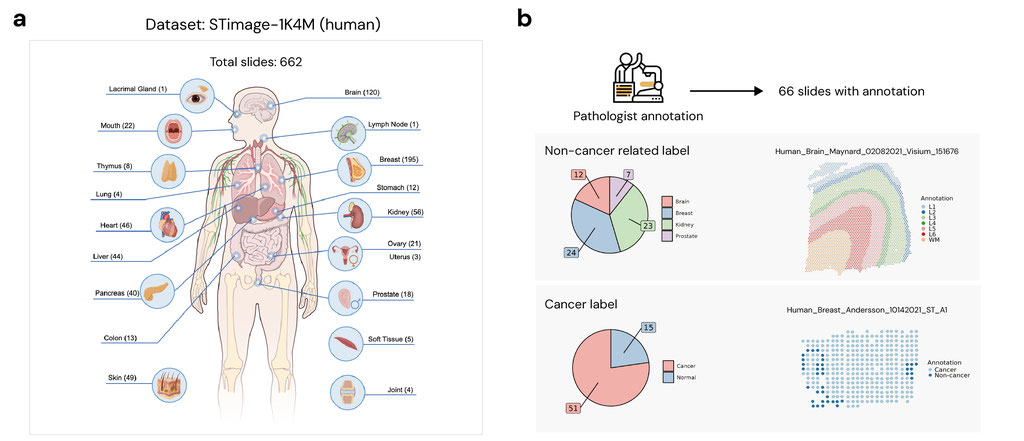
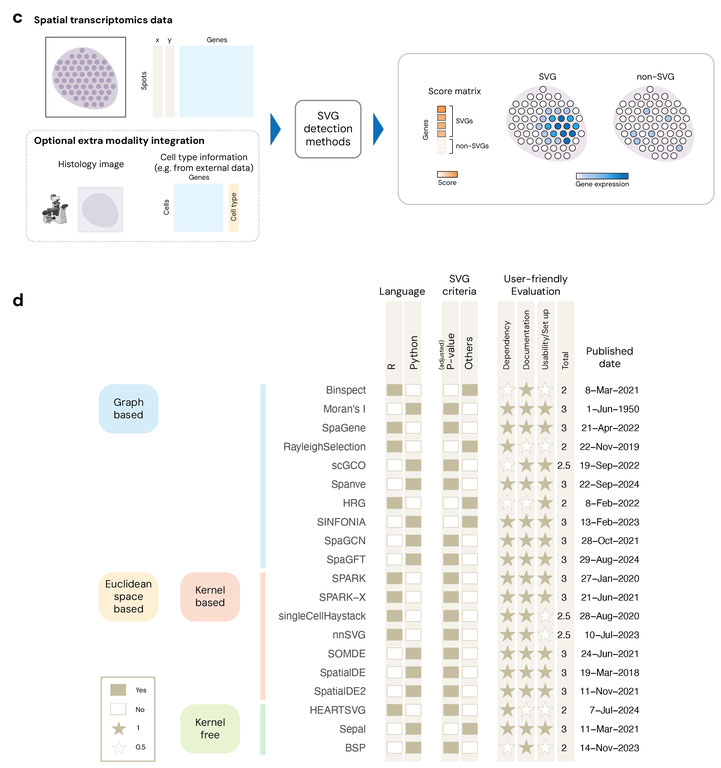
Figure 1. Overview of the STimage-1K4M dataset and SVG methods.
The central goal of this study was two-fold: (1) to rigorously evaluate the performance of SVG detection methods across a wide range of biological conditions, and (2) to use the resulting output to construct a reusable resource for downstream analysis, hypothesis generation, and tissue-level comparison.
In the first part of our analysis, we evaluated 20 SoTA SVG detection algorithms (Figure 1d) with respect to three core criteria: biological relevance, robustness, and computational efficiency. To assess biological validity, we compared the top-ranked SVGs from each method to gold-standard marker gene sets derived from differential expression (DE) analysis on pathologist-annotated regions (e.g., cancer v.s. non-caner, cortical layer etc., Figure 1b, Figure 2a). These annotations provide a ground truth for evaluating whether each method can recover genes with spatial patterns aligned to histologically defined domains. To assess robustness, we measured the cross-slide reproducibility of each method’s SVG set within the same tissue type, both within and across independent studies (Figure 2b). In addition, geometric robustness is a critical consideration in the design of ST methods. In practical settings, the orientation of a tissue section on a slide is arbitrary and should not influence the biological interpretation of spatial gene expression patterns. We evaluated geometric robustness by testing method's sensitivity to systematic spatial coordinate rotation (Figure 2c). We rotated spatial coordinates by 30◦, 60◦, 90◦, and compared the rotated results with the original unrotated result. In addition, we assessed computational scalability by applying all methods to high-resolution Visium HD slides. These slides, which contain more than 300,000 spots per tissue, allowed us to quantify runtime, memory usage, and failure rates under massive spatial data settings.
The second part of the analysis centers on constructing an atlas of spatial gene expression programs. For each slide, we collected the SVGs identified by each method and aggregated them by tissue type, disease state, and platform. This allowed us to compute pairwise tissue-tissue similarity metrics (e.g., Jaccard Index) and explore how spatial programs vary between cancer and non-cancer tissues, for example, between metastatic and primary tumors, and across functionally related tissues (e.g., lymph node vs. thymus). This atlas serves not only as a benchmarking reference, but also as a resource for biological discovery, which enables researchers to compare tissues, identify shared or divergent spatial signatures, and explore conserved pathways. We also developed a public-facing web portal that hosts all benchmarking results, method outputs, runtime statistics, and the SVG atlas. Users can interactively explore SVG overlaps, compare tissue-specific programs, and identify the most reliable methods and gene sets for their use case.
Methodologically, we implemented 35 SVG detection methods and ultimately retained 20 for full benchmarking after excluding those that failed to scale or crashed frequently (see a list of methods kept in Figure 1d). The methods were implemented according to their documentation in the corresponding paper or on GitHub. All methods were run in a unified computational environment on university's high-performance computational server with standardized pre-processing, and evaluation metrics.
All results, including SVG sets across all tissues, benchmark scores, metadata, visualizations, as well as experimental details, have been made publicly available through a searchable and interactive web portal on Hugging Face. Reproducibility is ensured through fully documented, version-controlled workflows, and explicit logging of software versions and parameter settings. Together, this project provides a high-impact reference for ST and biological researchers and establishes a robust foundation for method development, tissue atlas, and biologically informed model design.
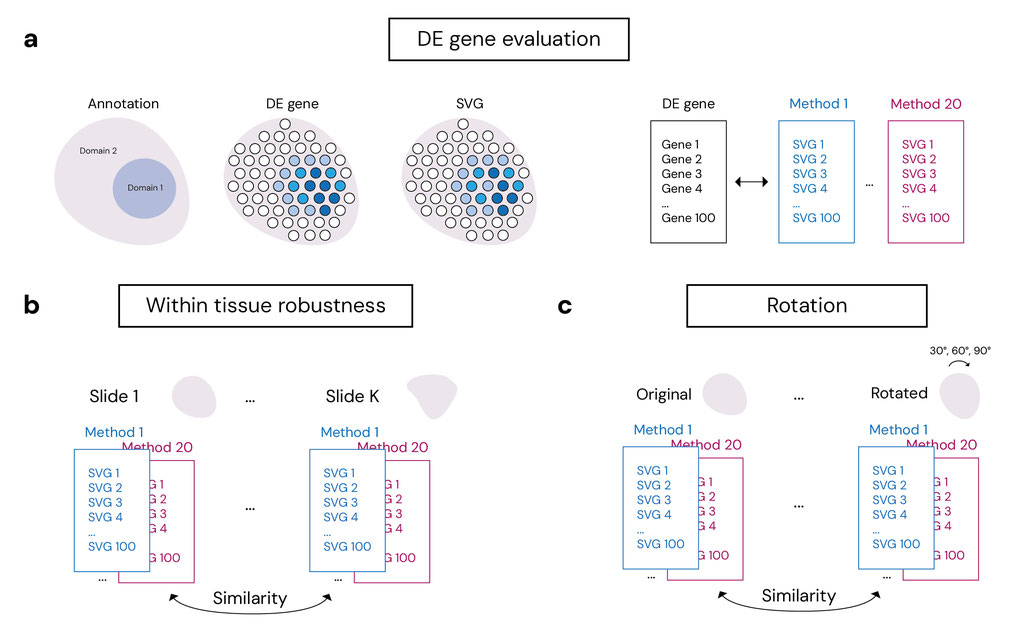
Figure 2. Benchmark analysis plan.
This project has created a large-scale, methodologically rigorous benchmark for SVG detection. Primary outcomes include: (1) a unified assessment of 20 SoTA SVG methods, (2) a curated SVG atlas across tissue types, disease states, and ST platforms, and (3) an open-access data and analysis portal supporting reproducibility and community engagement. Together, these deliverables provide critical infrastructure for evaluating, selecting, and applying ST methods in biomedical research.
To evaluate biological relevance, we compared each method’s detected SVG gene sets against domain-specific marker genes derived from DE analysis using pathologist-annotated spatial domains. SINFONIA, and Moran’s I show strong alignment with biologically meaningful markers, while others are more sensitive to tissue structure or noise (Figure 3a). Notably, slides with very high or low cancer content yielded uniformly poor performance across methods, highlighting a key limitation of current SVG algorithms: when a biological region is too small or too dominant, the spatial signal becomes diluted or undetectable. These findings underscore the sensitivity of SVG detection to domain imbalance and motivate future development of adaptive algorithms that incorporate tissue structure/complexity- or proportion-aware parameters.
We also assessed cross-slide reproducibility by measuring the pairwise Jaccard similarity of the top SVGs detected across slides within the same tissue type. HEARTSVG, and BSP emerged as consistently robust across both intra-study and cross-study comparisons. From a tissue-level perspective, liver, oral cavity, and central nervous system (CNS) exhibited the highest reproducibility in cancer settings, while breast and soft tissue showed lower consistency. In non-cancer samples, thymus and muscle yielded robust signals, whereas pancreas and skin were more variable. Importantly, certain tissues, such as soft tissue, demonstrated divergent robustness depending on disease status—high in cancer, low in normal—suggesting that pathological transformation alters spatial patterns even within the same organ. Additionally, we found that non-cancer tissues generally showed higher cross-slide consistency across all methods (Figure 3b).
In addition, we conducted a rotation analysis, rotating spatial coordinates and comparing with un-rotated results. SpaGCN, SINFONIA, HRG, and SPARK showed strong geometric robustness, maintaining consistent SVG detection performance across all rotated configurations (Figure 3c).
Regarding computational efficiency, on slides with <1,000 spots, 14 methods completed analysis within 10 minutes. For slides with ~10,000 spots, the runtime increased sharply for most methods, with only 11 methods maintaining runtimes under 10 minute. For Visium HD slides with >300,000 spots, only 12 completed analysis under 200 GB RAM; SPARK-X and SpaGene were the most efficient, completing both slides in under 10 minutes (Figure 3d).
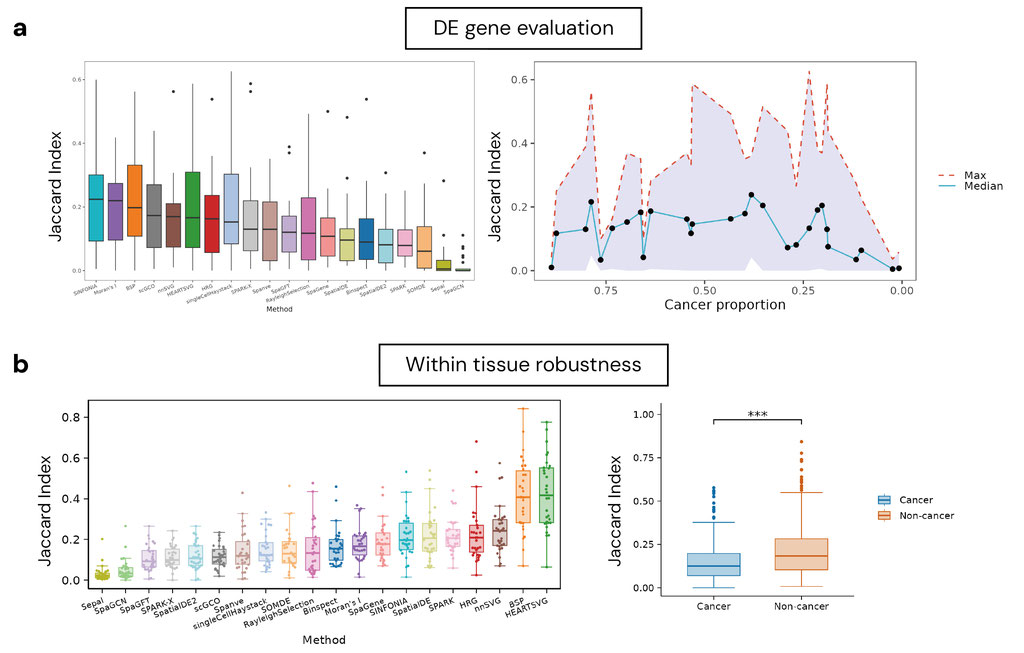
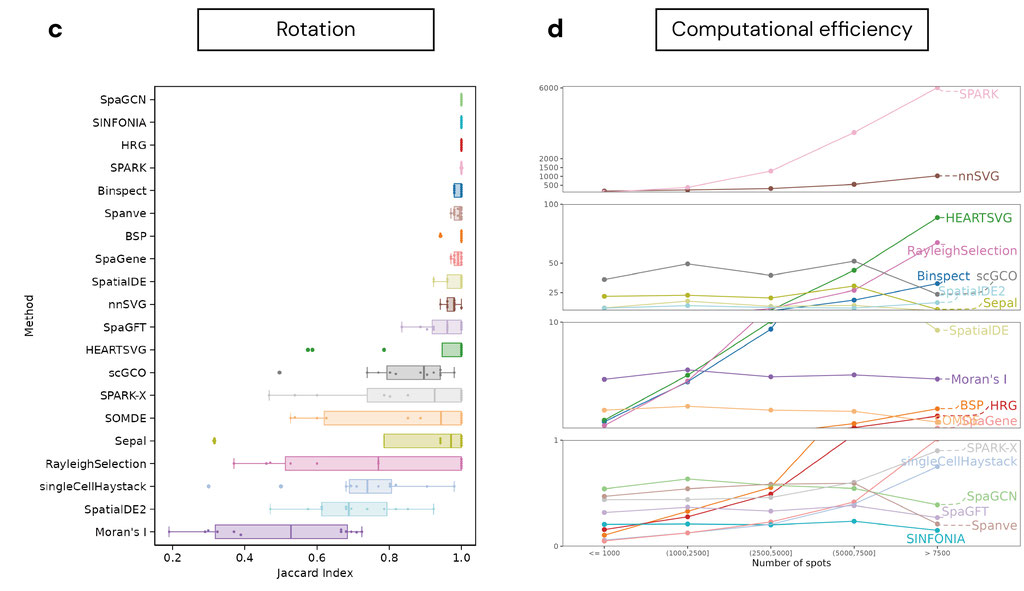
Figure 3. Benchmark results.
Finally, with this massive benchmarking effort, we are uniquely positioned to construct an atlas of SVGs for diverse tissue types. These tissue-specific SVG profiles offer valuable biological insights into both normal tissue architecture and disease-specific spatial organization (Figure 4). Within cancer tissues, we identified high SVG similarity between biologically plausible metastatic tissue pairs (e.g., breast-to-brain, lung-to-brain, and kidney-to-liver), suggesting that SVGs capture both tissue-of-origin and adaptation to the metastatic mechanism. In contrast, non-cancer tissues showed lower and more uniform similarity, with notable overlap between immunological tissues like thymus and lymph node. Comparing cancers to their normal counterparts revealed heterogeneous patterns: some cancers retained their tissue identity (e.g., ovary), while others aligned more with metastatic or immune tissues, reflecting tumor-specific rewiring of spatial programs.
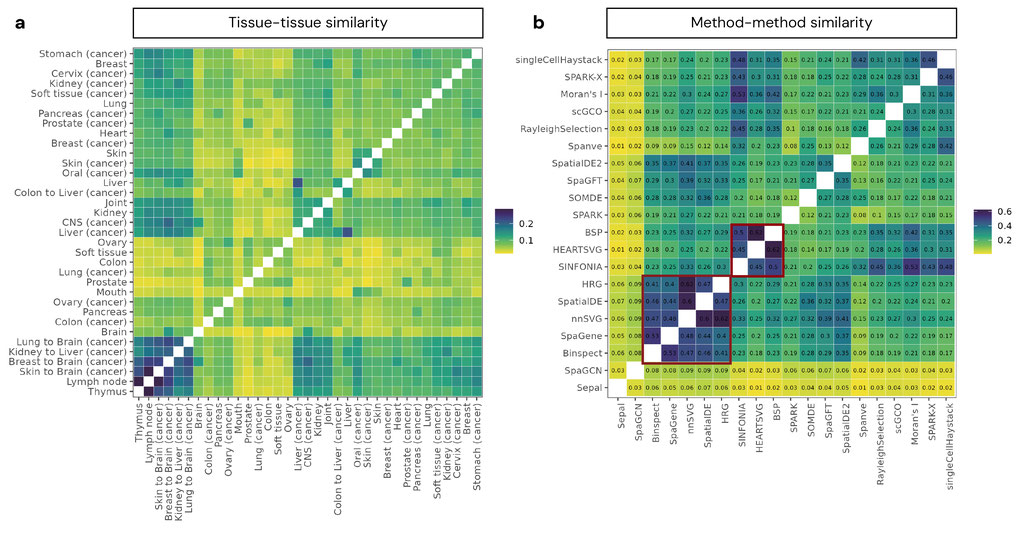
Figure 4. Spatial atlas results.
This project significantly advances the fields of ST, computational biology, and precision medicine by providing a robust and large-scale benchmark of SVG detection methods and constructing a comprehensive atlas of tissue-specific spatial gene expression programs. ST is an emerging technology with transformative potential for human health, enabling the study of how gene expression is organized within tissues and how this organization changes across disease states. However, the lack of systematic benchmarking and large scale atlas level analysis limits its potential to generalize. By rigorously evaluating 20 SoTA methods across 662 ST slides, covering 18 tissue types and both cancerous and non-cancerous slides, our study establishes critical performance baselines, highlights methodological strengths and weaknesses, and offers practical guidance for tool selection for domain scientists.
The spatial gene expression atlas that we constructed serves as a foundational resource for understanding tissue-specific biology and disease-specific spatial organization. For example, our analysis revealed that metastatic tumors often retain spatial gene signatures from both their tissue of origin and the metastatic target site, providing new insight into how cancer adapts to foreign microenvironments. Similarly, our observation of consistent spatial programs between thymus and lymph node suggests shared immune architectures that could be further explored in the context of immune-oncology. By enabling large-scale comparisons across tissues and disease states, this atlas opens new avenues for biomarker discovery, cross-tissue comparative analysis, and tissue stratification in complex diseases.
Beyond biological discovery, this work addresses practical barriers in ST adoption by evaluating computational robustness, runtime scalability, and sensitivity to tissue heterogeneity. This information is crucial for deploying ST pipelines in clinical or translational settings, where large-scale, high-resolution data is increasingly common. For instance, our results highlight which methods remain reliable when only a small spatial region is affected by disease, such as an early-stage tumor occupying a small proportion of the tissue, informing tool selection for early diagnosis scenarios.
Finally, by making all results and methods publicly available through an interactive portal and releasing the full STimage-1K4M benchmark dataset on Huggingface, this project promotes reproducibility, democratizes access to high-quality spatial benchmarks, and catalyzes future research. These resources empower clinicians, computational biologists, and data scientists to build upon our findings, refine current methodologies, and develop novel approaches tailored to specific biomedical questions. In sum, this work accelerates the integration of ST into health science research and supports its long-term translation into diagnostics, prognostics, and therapeutic decision-making.
The proposed project was successfully completed within the award period. Utilizing the STimage-1K4M dataset, we implemented 20 SoTA SVG detection methods across 662 human ST slides. All benchmarking evaluations and downstream analyses have been finalized, and the resulting manuscript is complete and ready for submission.
There were no major revisions to the project scope. Our original objective, to systematically benchmark SVG detection methods and construct a spatial gene expression atlas to uncover functional patterns across tissues and disease states, was fully achieved. One minor revision was the decision to focus solely on human data, rather than including cross-species comparisons. While human and mouse gene names often differ only in capitalization, aligning gene sets across species requires careful mapping and cross-context validation, which was beyond the scope of the current project.
In terms of data constraints, the STimage-1K4M dataset was well-curated and provided in accessible formats (e.g., plain CSV). However, for cancer vs. non-cancer comparisons, the study-level cancer annotations provided in the dataset were insufficient. To enable slide-level analysis, we manually curated cancer status and type for each slide by referencing associated GEO records, publications, and metadata. This refined annotation is now publicly available through our web portal, enhancing both reproducibility and downstream utility.
We conducted manual quality checks on the STimage-1K4M dataset. Spatial coordinates were verified by mapping spot locations on the original histology images, ensuring accurate alignment of transcriptomic signals to tissue regions. This alignment was visually inspected slide-by-slide. For gene expression data, we applied standardized pre-processing to remove low-quality genes/spots and ensure all included genes/spots were informative. Metadata curation was also critical as we used a lot of the label annotation in our study for tissue-specific, disease-specific, technology platform-specific analysis. We manually inspected and refined all study and slide labels, including cancer status, cancer type, tissue type, and platform annotations, to support downstream stratified analyses. Additionally, given the complexity of implementing 20+ spatial methods, we closely followed original documentation and pipelines, and proactively communicated with method authors when issues arose.
Reusing data from STimage-1K4M posed challenge around metadata quality. Because our analyses were stratified by tissue type, cancer status, and technology platform, accurate annotations were critical. While STimage-1K4M included study-level labels, we required slide-level annotations. To overcome this, we manually inspected and curated metadata for all 662 human slides, including tissue type, cancer presence and subtype, and platform identifiers, by cross-referencing GEO records, publications, and 10X documentation.
For analysis, implementing the SVG detection methods presented significant challenges due to installation issues, undocumented dependencies, and limited scalability. We addressed these by closely following each method's documentation and collaborating directly with authors via GitHub and email to resolve errors and clarify usage. These steps ensured data integrity and reliable benchmarking across our large-scale study.
